

Formatting your fields in your .yml files
Sometimes the format of things in your dbt project is different to how you want it to look in Lightdash. That’s okay! We’ve built a bunch of features to help you to format the fields in your dbt project so that the data in your Lightdash project looks exactly like you want it to 🥸The metrics and dimensions reference docs
We’re going to go through formatting your fields in more detail below, but you can see a list of these configurations and all of the other properties you can customize for your fields in the dimensions reference doc and metrics reference doc.Hiding fields
Sometimes, we have a bunch of columns in our YAML files that we might not want to include in Lightdash. For example, columns with PII data, or the same date data, but at different levels of date granularity. It’s easy to hide columns from Lightdash. All you need to do is add two words to your column:hidden: true.
In your dbt YAML file, it’ll look something like this:
- dbt v1.9 and earlier
- dbt v1.10+ and Fusion
- Lightdash YAML
- dbt v1.9 and earlier
- dbt v1.10+ and Fusion
- Lightdash YAML
hidden: false.
Grouping fields in the sidebar
You can group related metrics and dimensions together using the model metagroup_details block in combination with the groups property in your .yaml files. You can as well add descriptions to your groups using the property description that will be displayed when hovering over the group label.
Max grouping levels.There is a max of 2 levels of grouping in the sidebar.
group property to your metrics like so:
- dbt v1.9 and earlier
- dbt v1.10+ and Fusion
- Lightdash YAML
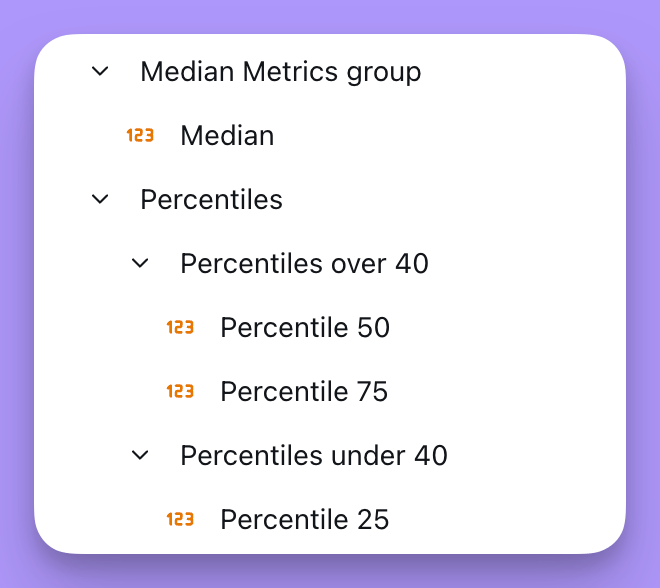
metrics section, and your dimensions will get grouped together under your label in the dimensions section.
Adding custom descriptions
Dimensions
By default, Lightdash pulls in the descriptions you’ve included for your dimensions. But, you can override the description you see in Lightdash using thedescription property.
- dbt v1.9 and earlier
- dbt v1.10+ and Fusion
- Lightdash YAML
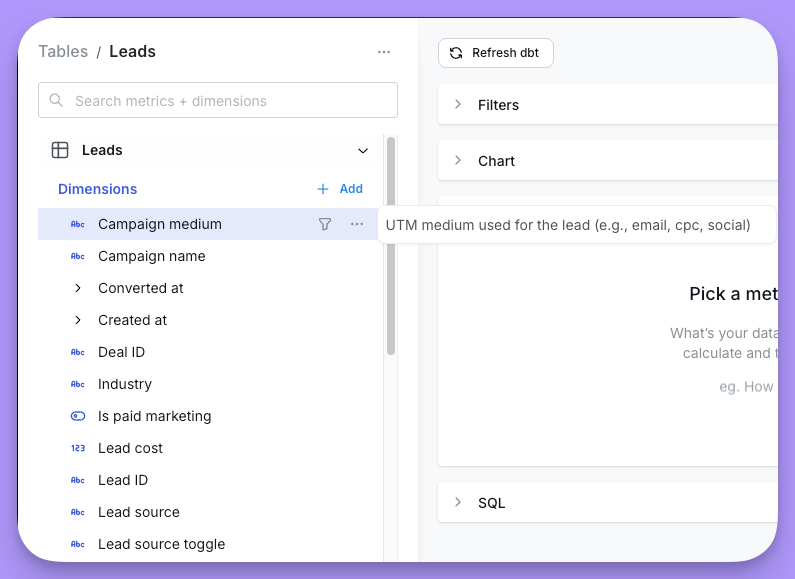
Metrics
If you don’t add a custom description for your metric, Lightdash will show a description for you in the app, by default. To override this default description, you can use thedescription property.
- dbt v1.9 and earlier
- dbt v1.10+ and Fusion
- Lightdash YAML
Renaming fields
Sometimes, the labels we use for the fields in our dbt project aren’t very user friendly. We might want to change these in Lightdash, and we can! To change the name you’ll see for your field in Lightdash, you just use thelabel property.
So, if I had a field user_id_sha64, I could relabel it to User ID.
- dbt v1.9 and earlier
- dbt v1.10+ and Fusion
- Lightdash YAML
Relabelling a metric will not break any saved charts that use the old metric name. Instead, your saved charts will just use the new metric name in their results tables.
- dbt v1.9 and earlier
- dbt v1.10+ and Fusion
- Lightdash YAML
Rounding
Rounding your metrics is easy to do using theformat property in your YAML file.
Here’s an example of how different rounding will affect your numbers:
Rounding dimensions
Like this:- dbt v1.9 and earlier
- dbt v1.10+ and Fusion
- Lightdash YAML
Rounding metrics
Like this:- dbt v1.9 and earlier
- dbt v1.10+ and Fusion
- Lightdash YAML
Compacting big numbers
Here’s an example of how different compacting will affect your numbers:Compact dimensions
Like this:- dbt v1.9 and earlier
- dbt v1.10+ and Fusion
- Lightdash YAML
Compact metrics
Like this:- dbt v1.9 and earlier
- dbt v1.10+ and Fusion
- Lightdash YAML
Add units to your values
Some columns need a special format to convey what units they’re in. For example, if you’re a global company, and you have arevenue field. Is that in GBP? USD?
In Lightdash, you can use the format label to add units to your fields.
Here’s an example of how different formats will affect your values:
Add units to dimensions
You can add aformat to your dimensions this:
- dbt v1.9 and earlier
- dbt v1.10+ and Fusion
- Lightdash YAML
Add units to metrics
You can add aformat to your metrics this:
- dbt v1.9 and earlier
- dbt v1.10+ and Fusion
- Lightdash YAML
Conditional formatting using parameters
You can make your field formatting dynamic by using parameters in your format strings. This allows the format to change based on user selections without needing to reconfigure your charts.Simple parameter substitution
You can reference parameter values directly in your format strings using the syntax${ld.parameters.parameterName}.
For example, if you have a parameter called currency_symbol, you can use it in your format like this:
Step 1: Define your parameter
In your lightdash.config.yml file:
- dbt v1.9 and earlier
- dbt v1.10+ and Fusion
- Lightdash YAML
'${ld.parameters.currency_symbol}0,0.00' will substitute the selected currency symbol value directly into the format.
When users select $ from the parameter dropdown, numbers will display as $1,234.56. When they select €, numbers will display as €1,234.56.
Conditional formatting with ternary expressions
For more complex formatting logic, you can use ternary expressions in your format strings. The syntax is:currency parameter:
Step 1: Define your parameter
In your lightdash.config.yml file:
- dbt v1.9 and earlier
- dbt v1.10+ and Fusion
- Lightdash YAML
- When
currencyis"usd", displays$1,234.56 - When
currencyis"eur", displays€1,234.56 - When
currencyis"gbp", displays£1,234.56
lightdash.config.yml:
- dbt v1.9 and earlier
- dbt v1.10+ and Fusion
- Lightdash YAML
decimals is "true", numbers display as $1,234.56. When decimals is "false", numbers display as $1,235.
Formatting your fields in the Lightdash UI
You can also format your fields in the Lightdash UI. This is useful if you want to format your fields quickly without having to change your YAML files. Currently you can format 2 types of fields in the Lightdash UI:Formatting metrics
Metrics formatting is currently only available for numeric metric types.
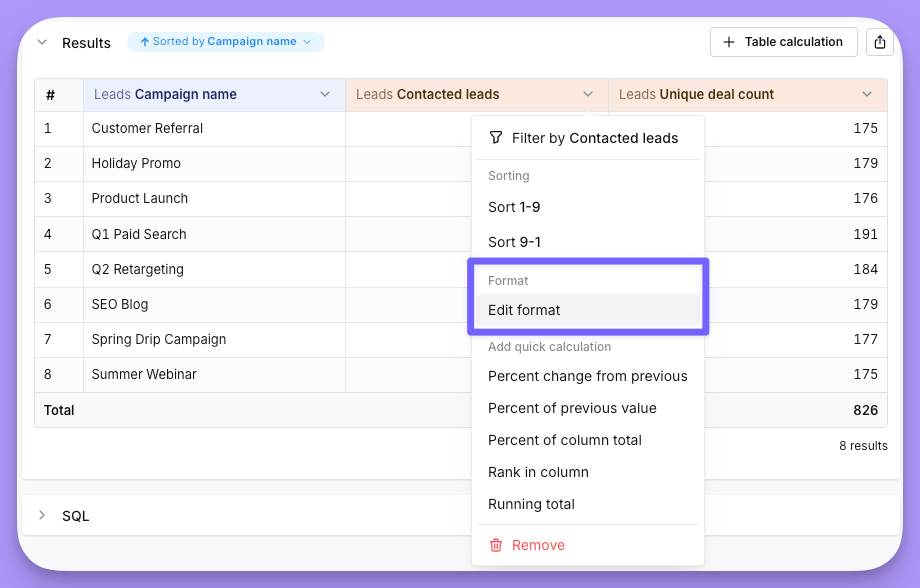
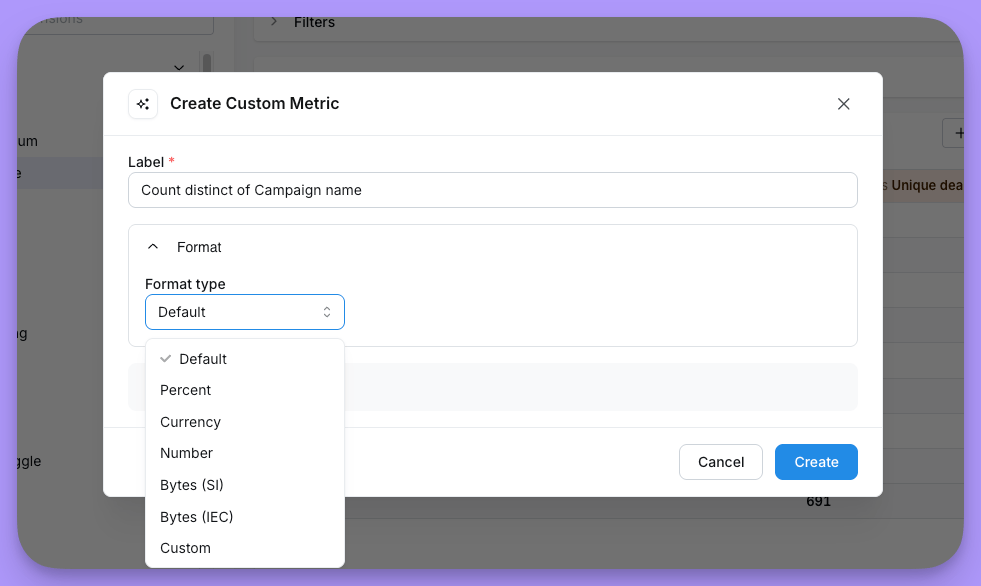
-
percent: Formats your metric as a percentage, with the following options:roundvalue to your metric to round it to a certain number of decimal placesseparator, e.g. from.to,
-
currency: Formats your metric as a currencyroundvalue to your metric to round it to a certain number of decimal placesseparator, e.g. from.to,currencysymbol, e.g. from$to£compactvalue to compact your metric to a certain unit, e.g. from1,000,000to1M
-
number: Formats your metric as a numberroundvalue to your metric to round it to a certain number of decimal placesseparator, e.g. from.to,compactvalue to compact your metric to a certain unit, e.g. from1,000,000to1Mprefixvalue to add a prefix to your metric, e.g.+or-suffixvalue to add a suffix to your metric, e.g.%
Formatting table calculations
On the results table, you can add a table calculation by clicking on the button on the right hand side of the section.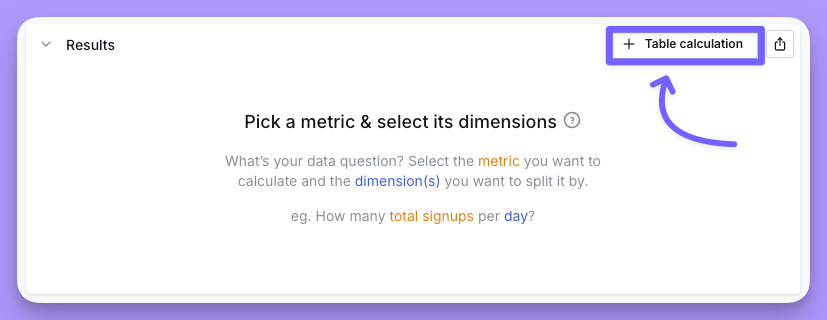
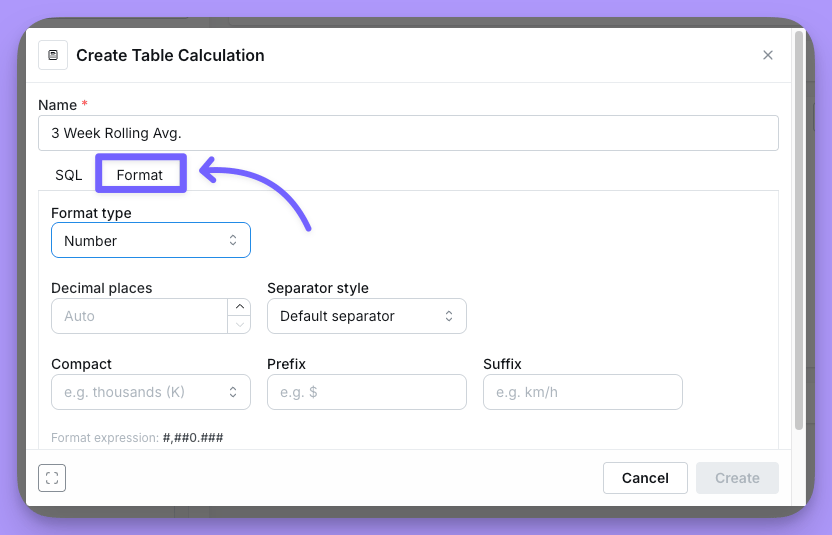
Format tab:
-
percent: Formats your metric as a percentage, with the following options:roundvalue to your metric to round it to a certain number of decimal placesseparator, e.g. from.to,
-
currency: Formats your metric as a currencyroundvalue to your metric to round it to a certain number of decimal placesseparator, e.g. from.to,currencysymbol, e.g. from$to£compactvalue to compact your metric to a certain unit, e.g. from1,000,000to1M
-
number: Formats your metric as a numberroundvalue to your metric to round it to a certain number of decimal placesseparator, e.g. from.to,compactvalue to compact your metric to a certain unit, e.g. from1,000,000to1Mprefixvalue to add a prefix to your metric, e.g.+or-suffixvalue to add a suffix to your metric, e.g.%